 Here we present the results of our benchmarking of ARCHER2. The benchmarks we are running are our HECBioSim benchmark suite here. Our benchmarks aren't too heavily tuned as these are designed to be used by our community to work out how much HPC time to ask for on this resource, so are set at a level that would be reasonable for any normal biomolecular MD simulation. More information on the benchmarks themselves can be found at the above link.
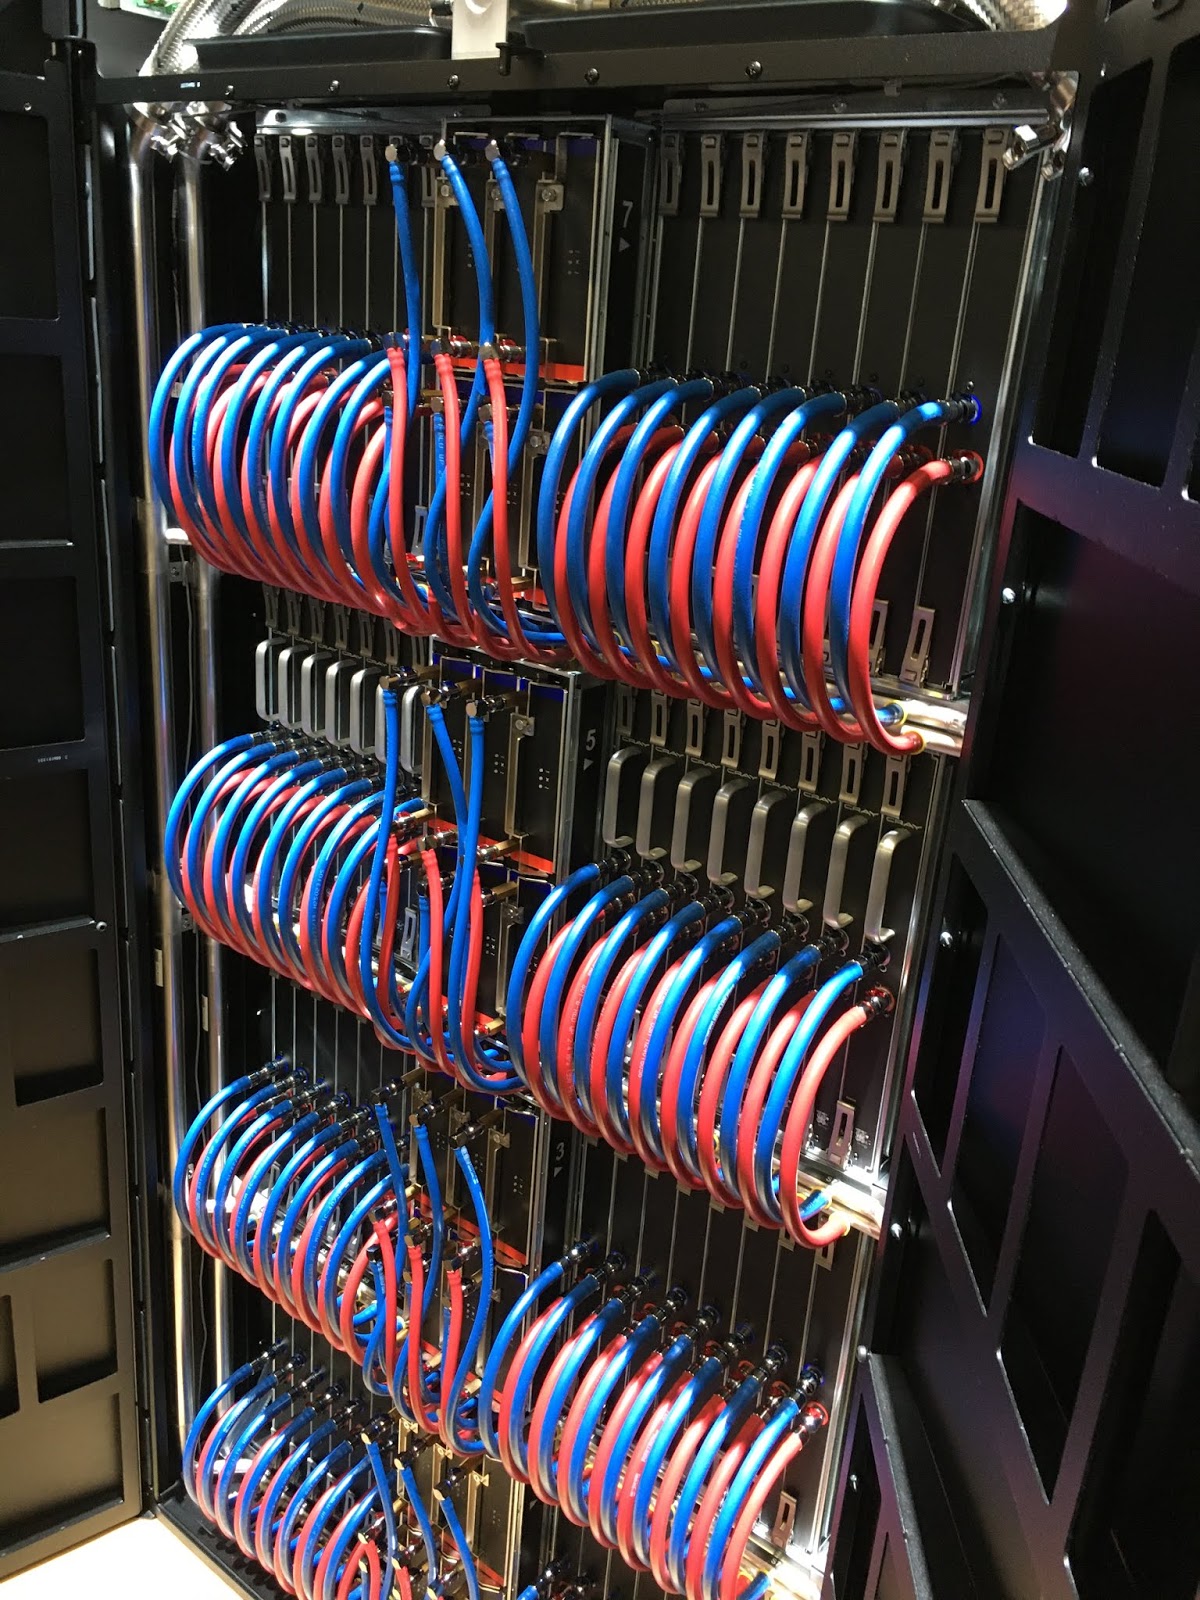
ARCHER2 is hosted by the EPCC and is the new Tier1 national machine in the UK. ARCHER2 is comprised of the Cray EX (formerly shasta) architecture and will consist of 5,848 nodes with each compute node having two 64-core AMD Zen2 (Rome) 7742 (8 NUMA regions) processors bringing a total of 748,544 cores. The majority of these nodes 5,848 having 256GB of RAM whilst 292 have high memory (512GB RAM). The compute nodes are connected via two high speed HPE Cray Slingshot bidirectional interconnects for fast parallel computation and have access to high performance parallel filesystems.
AMBER 20
| nodes | cores | 20k atoms | 61k atoms | 465k atoms | 1.4M atoms | 3M atoms |
| ns/day | ns/day | ns/day | ns/day | ns/day | ||
| 1 | 128 | 104.36 | 27.31 | 2.92 | 1.24 | 0.6 |
| 2 | 256 | 89.13 | 33.32 | 4.31 | 1.77 | 0.83 |
| 3 | 384 | 80.21 | 29.09 | 5.25 | 1.85 | 0.96 |
| 4 | 512 | 66.42 | 24.51 | 5.12 | 1.91 | 1.01 |
| 5 | 640 | 50.71 | 25.18 | 5.33 | 2.25 | 1.09 |
| 6 | 768 | 32.62 | 24.70 | 4.55 | 2.26 | 1.25 |
| 7 | 896 | 32.69 | 23.72 | 4.08 | failed | 1.15 |
| 8 | 1024 | 27.72 | 22.03 | 3.88 | failed | 1.26 |
| 9 | 1152 | 24.95 | 21.47 | 3.87 | 2.05 | 1.26 |
| 10 | 1280 | 21.07 | 19.58 | 4.25 | 2.25 | 1.14 |
| 12 | 1536 | 4.14 | failed | 1.16 | ||
| 14 | 1792 | 3.99 | 2.05 | 0.75 | ||
| 16 | 2048 | 3.59 | 2.14 | 0.92 | ||
| 18 | 2304 | 3.5 | 2.24 | 1.07 | ||
| 20 | 2560 | 3.38 | failed | 1.08 | ||
| 22 | 2816 | failed | 1.03 | |||
| 24 | 3072 | failed | 1.02 | |||
| 28 | 3584 | 1.79 | 1.02 |
Gromacs 2020.3 Single Precision
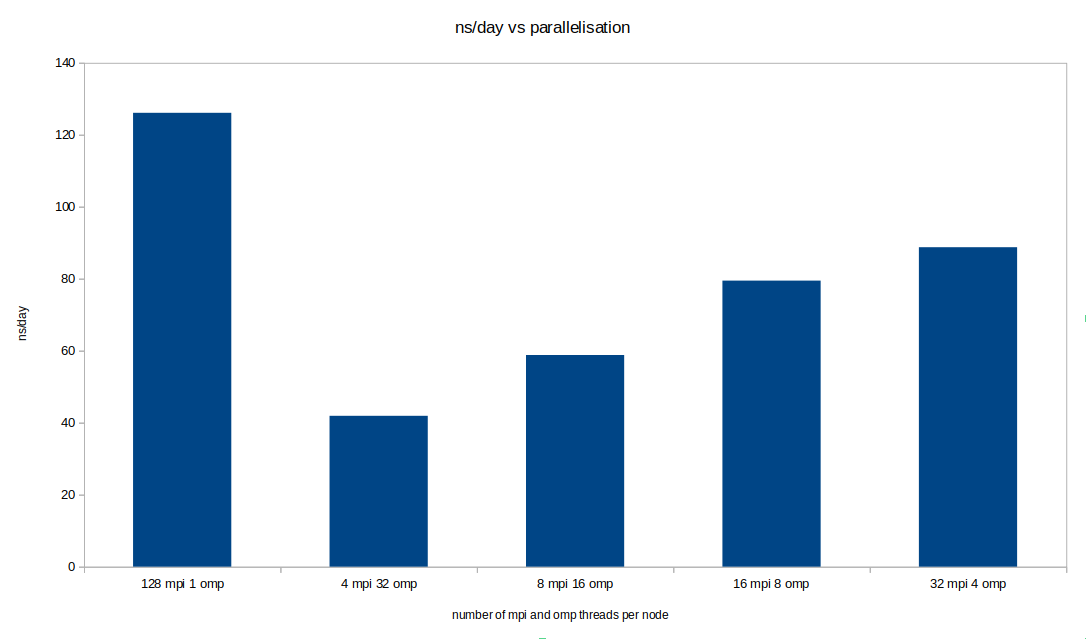
 With gromacs there are many options available to the user for parallelisation. On ARCHER2 the main options that make sense are the number of MPI ranks and the number of OpenMP threads assigned per node. We benchmarked a number of different configurations on ARCHER2 for each of the nodes counts in the table below. However the dataset is very large so we are only going to present the fastest case in the table below. The chart to the right shows a snapshot of these different configurations for one of the single node cases below. As can be seen, by far the best configuration is the case in which all processors are occupied by a single MPI thread.
| nodes | cores | 20k atoms | 61k atoms | 465k atoms | 1.4M atoms | 3M atoms |
| ns/day | ns/day | ns/day | ns/day | ns/day | ||
| 1 | 128 | 250.9 | 126.1 | 11.1 | 5.9 | 2.5 |
| 2 | 256 | 567.6 | 188.3 | 28.0 | 11.4 | 4.9 |
| 3 | 384 | 646.3 | 293.7 | 38.3 | 18.9 | 8.3 |
| 4 | 512 | 688.6 | 316.6 | 42.1 | 22.8 | 9.6 |
| 5 | 640 | 686.8 | 399.3 | 48.1 | 29.7 | 13.1 |
| 6 | 768 | failed | 404.8 | 56.1 | 34.6 | 15.1 |
| 7 | 896 | failed | 410.7 | 73.8 | 33.6 | 18.9 |
| 8 | 1024 | failed | 429.9 | 81.2 | 41.8 | 19.6 |
| 9 | 1152 | 466.1 | 92.6 | 47.1 | 22.9 | |
| 10 | 1280 | failed | 100.6 | 49.8 | 24.9 | |
| 12 | 1536 | failed | 107.8 | 60.2 | 30.0 | |
| 14 | 1792 | failed | 119.1 | 61.4 | 30.2 | |
| 16 | 2048 | 126.3 | 69.8 | 31.8 | ||
| 18 | 2304 | 137.7 | 64.3 | 38.8 | ||
| 20 | 2560 | 151.8 | 83.6 | 41.5 | ||
| 22 | 2816 | 152.4 | 82.0 | 42.3 | ||
| 24 | 3072 | 159.9 | 97.3 | 48.7 | ||
| 28 | 3584 | 173.3 | 105.6 | 55.3 | ||
| 32 | 4096 | 183.7 | 101.3 | 59.2 | ||
| 40 | 5120 | failed | 123.6 | 70.8 | ||
| 48 | 6144 | failed | 134.2 | 83.1 | ||
| 56 | 7168 | failed | 126.9 | 93.3 | ||
| 64 | 8192 | 126.7 | 93.8 | |||
| 72 | 9216 | 127.4 | 97.1 | |||
| 80 | 10240 | failed | 104.1 | |||
| 88 | 11264 | failed | 91.3 | |||
| 96 | 12288 | failed | 110.5 | |||
| 104 | 13312 | 91.3 | ||||
| 112 | 14336 | 111.6 | ||||
| 120 | 15360 | 111.2 | ||||
| 136 | 17408 | 104.1 | ||||
| 152 | 19456 | 94.8 | ||||
| 168 | 21504 | failed | ||||
| 184 | 23552 | failed | ||||
| 200 | 25600 | failed |
LAMMPS 03.3.2020
| nodes | cores | 20k atoms | 61k atoms | 465k atoms | 1.4M atoms | 3M atoms |
| ns/day | ns/day | ns/day | ns/day | ns/day | ||
| 1 | 128 | 37.0 | 14.3 | 2.1 | 0.7 | 0.10 |
| 2 | 256 | 58.7 | 25.0 | 3.8 | 1.3 | 0.20 |
| 3 | 384 | 74.4 | 31.4 | 5.6 | 2.0 | 0.30 |
| 4 | 512 | 84.9 | 40.1 | 7.2 | 2.5 | 0.38 |
| 5 | 640 | 81.0 | 45.6 | 8.7 | 3.1 | 0.47 |
| 6 | 768 | 90.6 | 49.2 | 10.2 | 3.7 | 0.57 |
| 7 | 896 | 94.1 | 53.0 | 11.3 | 4.2 | 0.66 |
| 8 | 1024 | 100.7 | 58.7 | 12.9 | 4.8 | 0.74 |
| 9 | 1152 | 101.3 | 63.7 | 13.9 | 5.2 | 0.84 |
| 10 | 1280 | 100.6 | 64.9 | 14.8 | 5.9 | 0.93 |
| 12 | 1536 | 103.5 | 69.2 | 17.3 | 6.6 | 1.05 |
| 14 | 1792 | 101.6 | 71.9 | 19.2 | 7.5 | 1.22 |
| 16 | 2048 | 103.6 | 77.6 | 21.0 | 8.4 | 1.33 |
| 18 | 2304 | 103.2 | 71.2 | 22.7 | 9.2 | 1.53 |
| 20 | 2560 | 101.8 | 73.8 | 23.7 | 10.2 | 1.71 |
| 22 | 2816 | 97.04 | 77.9 | 24.5 | 10.8 | 1.87 |
| 24 | 3072 | 103.7 | 75.8 | 27.1 | 11.4 | 2.01 |
| 28 | 3584 | 75.2 | 29.4 | 13.0 | 2.30 | |
| 32 | 4096 | 75.7 | 30.6 | 14.2 | 2.60 | |
| 40 | 5120 | 16.3 | 3.14 | |||
| 48 | 6144 | 18.1 | 3.70 | |||
| 56 | 7168 | 19.5 | 4.20 | |||
| 64 | 8192 | 21.2 | 4.73 | |||
| 72 | 9216 | 20.3 | 5.14 | |||
| 80 | 10240 | 21.1 | 5.52 | |||
| 88 | 11264 | 21.1 | 5.98 | |||
| 96 | 12288 | 21.1 | 6.16 | |||
| 104 | 13312 | 21.6 | 6.49 | |||
| 112 | 14336 | 20.1 | 6.93 | |||
| 120 | 15360 | 23.3 | 7.20 | |||
| 136 | 17408 | 7.77 | ||||
| 152 | 19456 | 8.29 | ||||
| 168 | 21504 | 8.69 | ||||
| 184 | 23552 | 8.91 | ||||
| 200 | 25600 | 9.33 |
NAMD 2.14
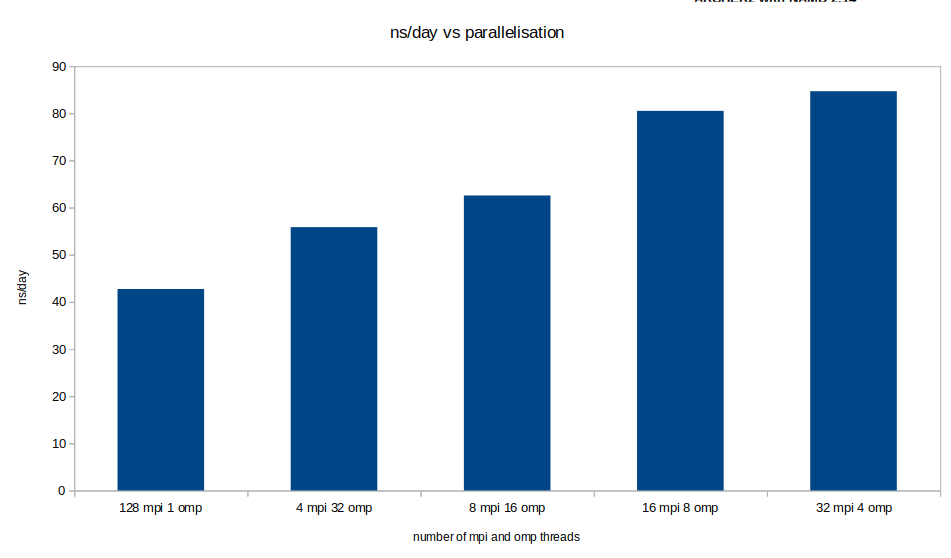
 With NAMD there are many options available to the user for parallelisation. On ARCHER2 the main options that make sense are the number of MPI ranks and the number of OpenMP threads assigned per node. We benchmarked a number of different configurations on ARCHER2 for each of the nodes counts in the table below. However the dataset is very large so we are only going to present the fastest case in the table below. The chart to the right shows a snapshot of these different configurations for one of the single node cases below. As can be seen, the best configurations are when each node is occupied by either 16 MPI and 8 OMP threads or marginally faster 32 MPI and 4 OMP threads per node.
| nodes | cores | 20k atoms | 61k atoms | 465k atoms | 1.4M atoms | 3M atoms |
| ns/day | ns/day | ns/day | ns/day | ns/day | ||
| 1 | 128 | 84.7 | 32.2 | 4.3 | 1.4 | 0.50 |
| 2 | 256 | 123.0 | 59.6 | 8.4 | 2.8 | 0.91 |
| 3 | 384 | 159.0 | 83.0 | 12.7 | 2.9 | 1.38 |
| 4 | 512 | 172.0 | 76.4 | 16.4 | 5.5 | 2.60 |
| 5 | 640 | 209.3 | 107.9 | 20.3 | 4.7 | 2.20 |
| 6 | 768 | 225.1 | 110.7 | 23.4 | 5.4 | 2.63 |
| 7 | 896 | 232.1 | 103.6 | 18.8 | 7.9 | 3.32 |
| 8 | 1024 | 196.8 | 117.0 | 25.7 | 7.7 | 5.05 |
| 9 | 1152 | 226.5 | 126.1 | 33.6 | 8.8 | 5.71 |
| 10 | 1280 | 233.7 | 123.9 | 36.5 | 9.1 | 4.33 |
| 12 | 1536 | 228.3 | 142.4 | 41.6 | 11.3 | 7.64 |
| 14 | 1792 | 233.9 | 149.2 | 45.2 | 12.9 | 8.77 |
| 16 | 2048 | 245.3 | 140.0 | 40.6 | 15.1 | 9.82 |
| 18 | 2304 | 262.9 | 167.5 | 48.3 | 23.0 | 10.43 |
| 20 | 2560 | 244.9 | 167.2 | 50.4 | 18.3 | 8.79 |
| 22 | 2816 | 231.5 | 158.9 | 55.0 | 21.3 | 9.04 |
| 24 | 3072 | 241.7 | 181.9 | 64.1 | 28.8 | 10.14 |
| 28 | 3584 | 167.4 | 60.9 | 24.8 | 16.34 | |
| 32 | 4096 | 109.8 | 81.7 | 36.1 | 17.90 | |
| 40 | 5120 | 72.8 | 32.8 | 22.22 | ||
| 48 | 6144 | 96.1 | 35.7 | 26.11 | ||
| 56 | 7168 | 101.0 | 41.6 | 23.38 | ||
| 64 | 8192 | 106.7 | 49.4 | 26.66 | ||
| 72 | 9216 | 108.8 | 50.3 | 32.36 | ||
| 80 | 10240 | 112.9 | 41.6 | 30.73 | ||
| 88 | 11264 | 119.5 | 42.3 | 33.86 | ||
| 96 | 12288 | 93.1 | 51.4 | 33.45 | ||
| 104 | 13312 | 99.0 | 51.3 | 33.84 | ||
| 112 | 14336 | 122.8 | 58.2 | 33.84 | ||
| 120 | 15360 | 115.3 | 52.1 | 32.77 | ||
| 136 | 17408 | 111.0 | 68.7 | 37.97 | ||
| 152 | 19456 | 139.8 | 67.9 | 42.25 | ||
| 168 | 21504 | 117.2 | 67.2 | 47.59 | ||
| 184 | 23552 | 96.8 | 76.0 | 38.84 | ||
| 200 | 25600 | 66.6 | 40.73 | |||
| 240 | 30720 | 68.9 | 45.49 | |||
| 280 | 35840 | 81.3 | 44.67 | |||
| 320 | 40960 | 65.6 | 52.17 | |||
| 360 | 46080 | 73.5 | 48.89 | |||
| 400 | 51200 | 62.4 | 44.51 | |||
| 440 | 56320 | 45.56 | ||||
| 480 | 61440 | 43.87 | ||||
| 520 | 66560 | 45.37 | ||||
| 560 | 71680 | 43.54 | ||||
| 600 | 76800 | 45.64 | ||||
| 640 | 81920 | 39.98 | ||||
| 680 | 87040 | 35.93 |
